D-GENIES is an online tool designed to compare two genomes. It supports large genome and you can interact with the dot plot to improve the visualisation. We use minimap version 2 to align the two genomes. Then, the PAF file is parsed and plotted into an interactive plot written with d3.js library. D-Genies also allows to display dot plots from other aligners by uploading their PAF or MAF alignment file.
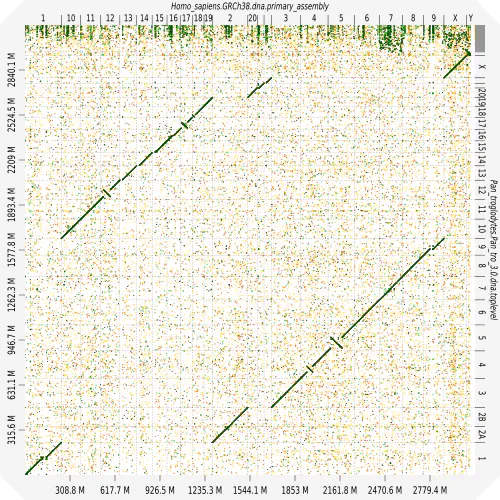
Dot plots are widely used to quickly compare sequence sets. They provide a synthetic similarity overview, highlighting repetitions, breaks and inversions. Different tools have been developed to easily generated genomic alignment dot plots, but they are often limited in the input sequence size. D-GENIES is a standalone and WEB application performing large genome alignments using minimap2 software package and generating interactive dot plots. It enables users to sort query sequences along the reference, zoom in the plot and download several image, alignment or sequence files. D-GENIES is an easy to install open source software package (GPL) developed in Python and JavaScript.
The source code is available at Github and it can be tested at Genotoul-bioinfo instance.